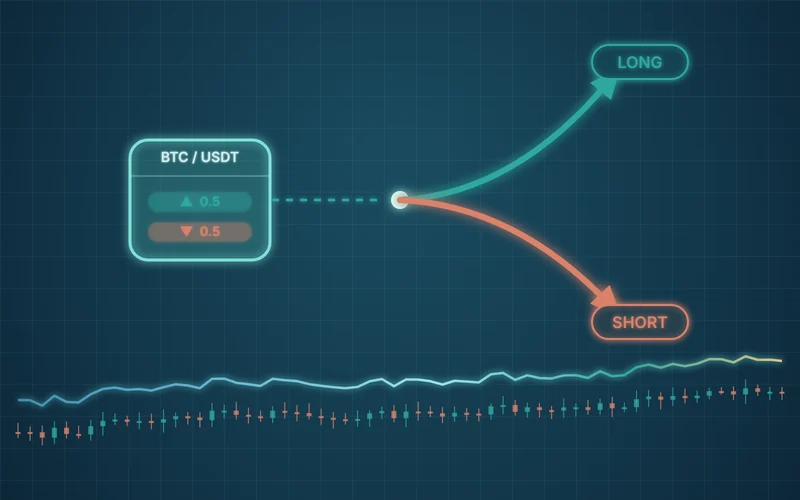
The most common first bot is a grid: buy every step down, sell every step up inside a price range. Binance, Bybit, OKX and BingX offer it for free. So why would anyone pay a share of profit for a ready-made strategy? Let us compare them honestly.
How a grid earns
Inside its range a grid is a machine for collecting small moves: every oscillation between two levels is a closed trade with a fixed profit. In a sideways market with high volatility this adds up fast, and the result does not depend on predicting the direction.
How a grid loses
A grid has no opinion about the market, which is its weakness as much as its strength:
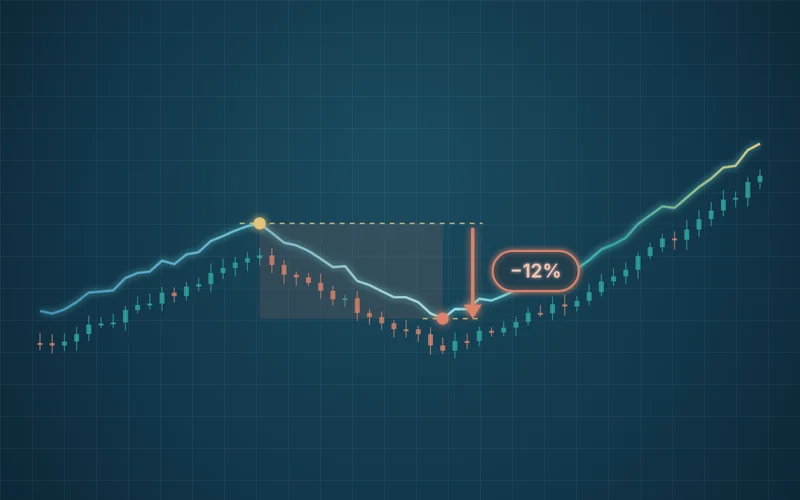
- Price leaves the range. Below the range a long grid holds a full set of bought levels and stops earning; above it the grid has sold everything and watches the move without a position. Most grid losses come from this moment.
- No stop by default. The usual advice is to set the range wide enough; in practice the user chooses the stop and often chooses none.
- Range selection is the whole strategy. The free bot executes; you decide where the market will trade for the next weeks. That is the hard part, not the execution.
What a ready-made strategy adds
EDVI's strategies are not grids with better defaults. They are rules developed and tested over years:
- Direction logic. Trend-following bots ride moves instead of selling into them; counter-trend bots (Lion) buy pullbacks inside an uptrend rather than any price in a box.
- Exits and stops. Take-profit on the return to the mean, stop-loss on reversal, defined by the strategy, not by the user.
- Short side. Wolf and Mole short overextended rises, so a falling market is tradable rather than only survivable.
- Breadth. 40+ pairs with the same rules, instead of one grid per pair you configure by hand.
- Public statistics. Every bot is tested daily on history, with drawdowns, per pair. A grid's result is only known after you run it.
Which earns more?
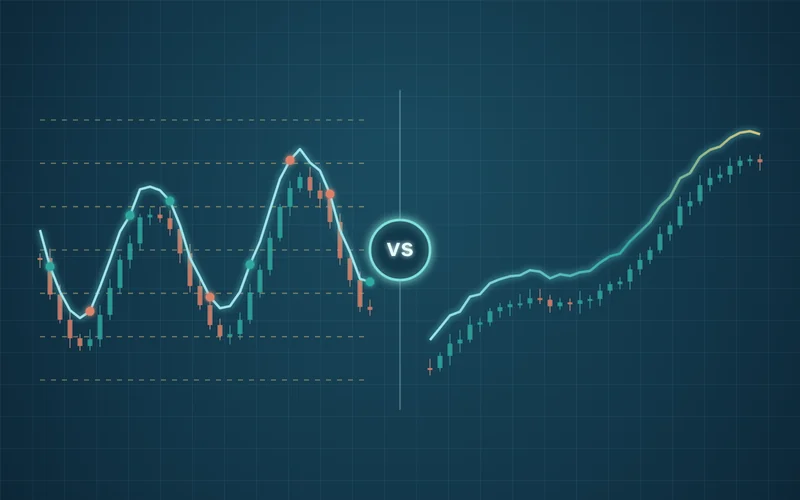
In a long sideways market a well-placed grid can beat any directional strategy, and it will do so for free. In a trending market the grid either runs out of inventory or sits in a drawdown, while a strategy with direction and stops keeps trading. Over a full cycle the answer depends on the ranges you would have picked, which nobody can backtest for you.
That is why the only fair comparison is your grid's realized result against the public result of the strategy over the same months, both after fees. If your grid wins, keep it. If the strategy wins by more than its fee, the fee was worth paying.
The cost side
EDVI charges 40% of the net profit of the month, nothing in a losing month, no subscription. For the comparison with the free grid, that means the strategy has to earn at least 1 / (1 - 40/100) times what the grid earns to leave you with the same money: at 40% that is roughly 1.7 times. The EDVI vs exchange bots page has the detailed table.
A practical path
- Run the exchange's grid on one pair for two months and write down the net result, including the open loss when the price leaves the range.
- Compare it with the same two months on the strategy page for the same pair.
- If the strategy is ahead after the fee, connect it on a sub-account with a small multiplier and compare again after a quarter.
Neither tool is magic. The grid is free and blind; the strategy has rules and a price. Pick by numbers, not by the word "bot".